Benefits of using Prometheus and Grafana over Azure Monitor for Monitoring AKS Clusters

Dinu Raj D, July 2024

When it comes to monitoring AKS clusters, both Prometheus and Grafana can be used hand in hand to provide a comprehensive monitoring solution. The Azure platform has its own monitoring tool called “Azure monitor” which has a managed service for Prometheus for providing a fully managed Prometheus environment for collecting and storing metrics from the AKS clusters, in this article we are comparing and highlighting some of the benefits of using an entirely separate Prometheus and Grafana environment for monitoring the AKS cluster.

Following are some key features and best practices for monitoring AKS clusters with Azure Monitor:

Monitoring AKS Clusters using Azure monitor

  1. Azure Monitor Container Insights: This feature provides a unified monitoring experience for your AKS clusters, allowing you to collect and analyze metrics, logs, and traces from your containers and Kubernetes clusters.
  2. Managed Prometheus: Azure Monitor managed service for Prometheus provides a fully managed Prometheus environment for collecting and storing metrics from your AKS clusters.
  3. Container Insights Workbooks: These pre-built workbooks provide interactive reports that help you analyze cluster performance, troubleshoot issues, and optimize your applications.
  4. Metrics: Monitor AKS cluster performance metrics, such as CPU, memory, and disk usage, to identify potential issues and optimize resource allocation.
  5. Logs: Collect and analyse logs from your AKS clusters to troubleshoot issues, identify errors, and optimize application performance.

Now let’s go through some benefits of using Prometheus and Grafana for the AKS monitoring.

One key advantage of using Prometheus is its ability to scrape metrics directly from the AKS cluster, whereas the Grafana plugin for Azure Monitor is limited to Azure Monitor. This allows Prometheus to provide more granular and detailed metrics about the cluster, which can be useful for troubleshooting and optimization.

On the other hand, Grafana provides a more user-friendly interface for visualizing and exploring the metrics collected by Prometheus. Grafana’s dashboards can be used to create customized views of the cluster’s performance, which can be helpful for identifying trends and anomalies.

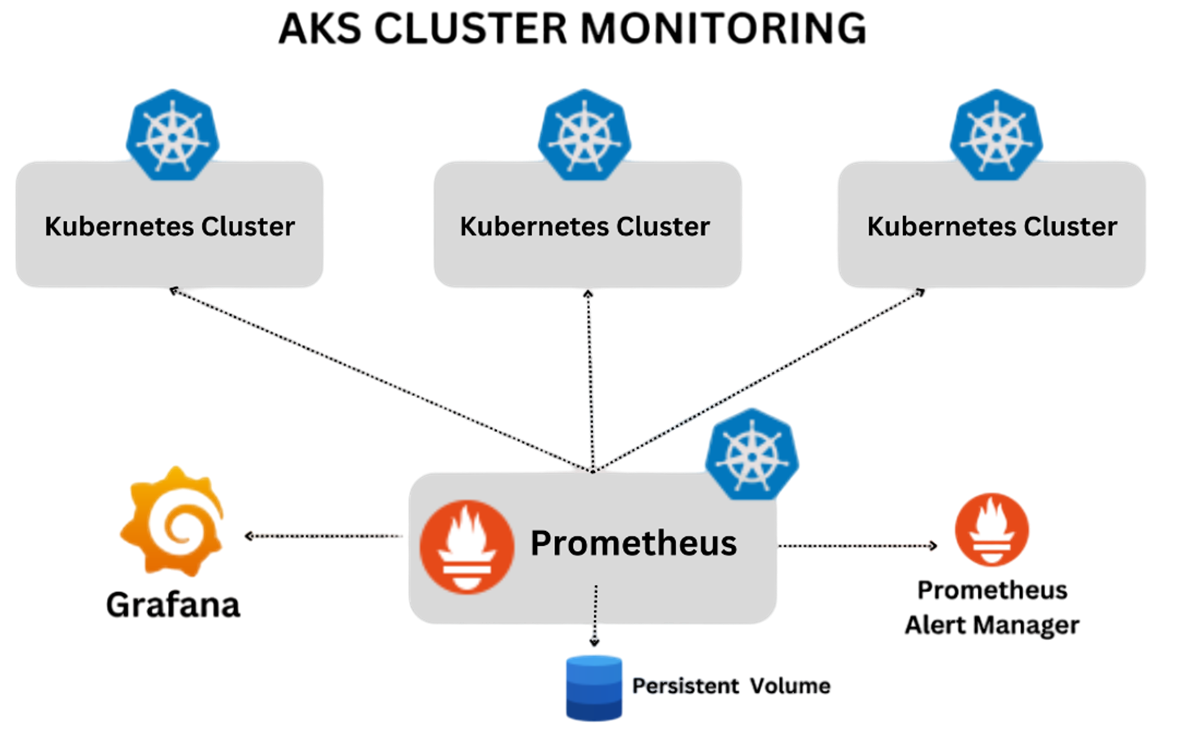
In terms of implementation, Prometheus can be used to scrape metrics from the AKS cluster and then send them to a Prometheus-compatible data store, such as a Timescale DB instance. Grafana can then be used to create dashboards that visualize the metrics collected by Prometheus. Some of the features and best practices of Prometheus and Grafana are as follows

  • An open-source monitoring system with a dimensional data model
  • Flexible query language (PromQL) for querying metrics
  • Efficient time series database for storing and querying metrics
  • Modern alerting approach with support for multiple notification channels
  • Support for multiple data sources, including Prometheus, Elasticsearch, Influx DB, and more
  • Extensive plugin ecosystem for adding new data sources, panels, and features
  • Customizable dashboards and visualizations
  • Support for alerting and notification based on thresholds and conditions

Now let’s check what are the features and benefits of choosing the Prometheus and Grafana over the Azure monitor for monitoring AKS clusters in the Azure environment.

  1. Visualization

    Grafana offers various types of visualizations, including:

    • Time Series Graphs: These visualizations are ideal for displaying data that changes over time, such as metrics, logs, and traces.
    • Heatmaps: Heatmaps are useful for visualizing large datasets and identifying patterns and correlations.
    • Cutting-edge 3D Charts: Grafana’s 3D charts provide a unique way to visualize complex data and identify relationships between different variables.
    • Bar Charts: Bar charts are suitable for displaying categorical data and comparing values across different categories.
    • Stat: The Stat visualization provides a single value with an optional graph sparkline, making it easy to display key metrics.
    • Gauge: Gauges are used to display a single value within a range, providing a visual representation of progress or performance.
    • Bar Gauge: The Bar Gauge visualization displays a value as a bar within a range, providing a more detailed view of the data.
  2. Usage of PromQL

    PromQL is used for querying data from Prometheus. Can be useful while creating dashboards or panels in Grafana
    Grafana’s Prometheus Query Editor
    Grafana provides a query editor for the Prometheus data source, which allows users to create queries in PromQL. The query editor is available in two modes: Code mode and Builder mode.

    • Code mode: This mode is for experienced Prometheus users who have prior expertise in PromQL. The Code mode editor allows users to create queries just as they would in Prometheus.
    • Builder mode: This mode is for users who have limited or no previous experience working with Prometheus and PromQL. The Builder mode helps users build queries using a visual interface.
      Here the important point is that Azure monitor service doesn’t yet have any mode as easy as Builder mode.
  3. Cost of implementation

    Software Costs: Prometheus and Grafana are open source, so there are no software costs associated with its implementation.

As an endnote to this topic, I should also point out the downside of the Prometheus and Grafana implementations. There are two major costs in the environment: the server and the management. There are, however, some strategies that can be used to mitigate this.

Cost-Effective Strategies:

To reduce the cost of implementation and management, consider the following strategies:

  • Use Open-Source Tools: Both Prometheus and Grafana are open-source, which means you can implement them without incurring software costs.
  • Optimize Hardware: Ensure that your hardware is optimized for the specific requirements of Prometheus and Grafana to reduce energy consumption and costs.
  • Engage right solution partners: Consider engaging the right solutions partners for design and implementation of the solution, this will help optimize the cost.
  • Scalability: Implement scalability measures to reduce the cost of hardware and maintenance as your infrastructure grows.

Using Prometheus and Grafana, we can gain valuable insights into the utilization of your infrastructure resources (e.g. CPU, memory, storage etc). Through improved monitoring and management, we will be able to ensure that only optimum resources are allocated to the application and hence reduce the cost.